2023-09-16: LLM Observability, eBPF for chaos engineering, auto-instrumentation with Odigos, IAST, eBPF Summit recap, GitLab DevSecOps AI report
Thanks for reading the web version, you can subscribe to the Ops In Dev newsletter to receive it in your mail inbox.
👋 Hey, lovely to see you again
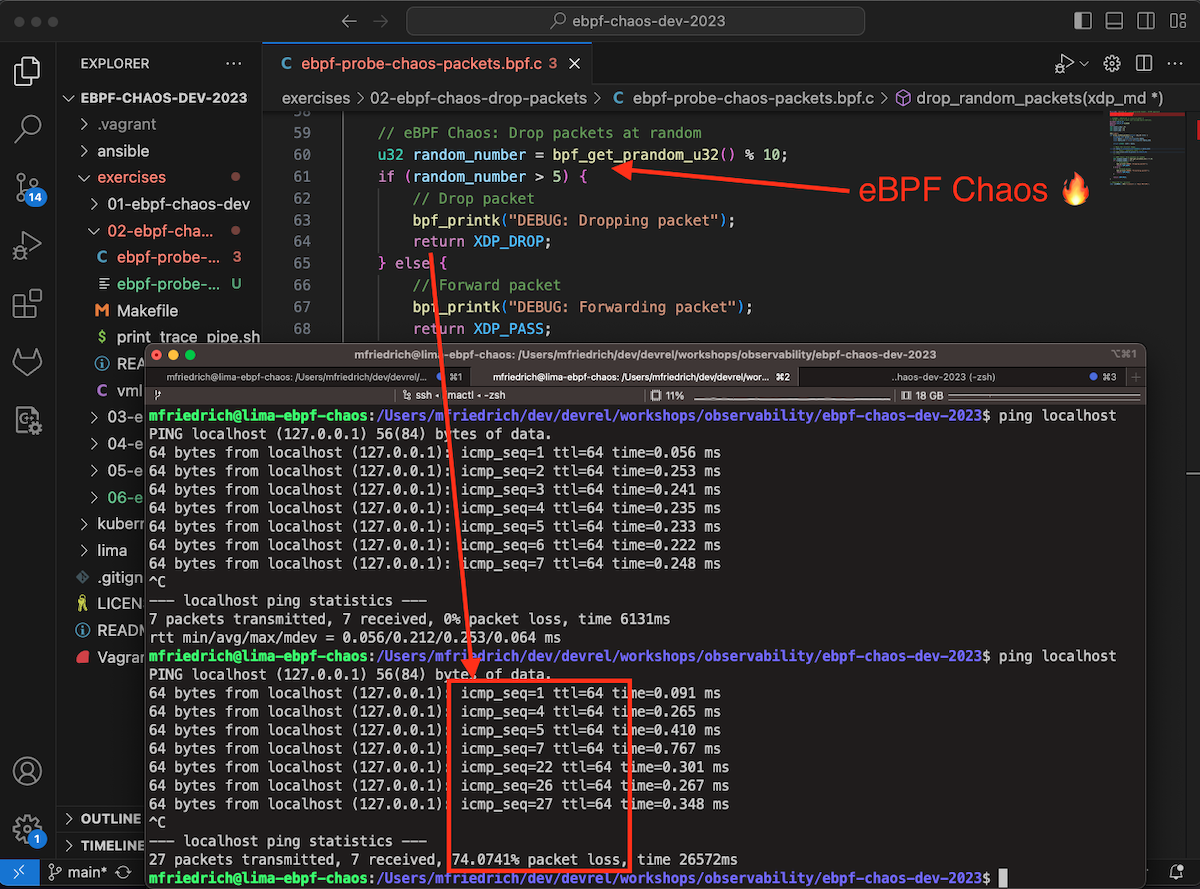
September started with events again: Container Days EU, eBPF Summit, SRE Days, to name a few. I spoke at Container Days about eBPF and how it benefits observability and chaos engineering (slides, repository with a packet drop chaos experiment using eBPF), and then left on a plane to London for the GitLab Developer Relations onsite.
eBPF Summit was planned for later in the week, and I mixed up the dates and days. The event was on Wednesday, not Thursday ... thankfully, all sessions are recorded in the live stream, and the organizers added timestamps into the eBPF Summit 2023 YouTube video already. All talks are great learning resources, I'll share a few favorites. Depending on your knowledge, you may want to dive into learning eBPF first.
- Why eBPF is Essential by Brendan Gregg
- On the integration of Machine Learning Models within the Linux Kernel through eBPF-based development by Irene Bru-Santa, Jorge Callego
- Lies, damned lies and request times by Nikola Greevski
- Reliable User Space TLS tracing with eBPF by Dom Del Nano
- Inspektor Gadget: A container-like runtime for eBPF programs by Mauricio Vasquez Bernal
- State synchronization of eBPF Maps for high-availability applications by Dip Saikia, Nikhil Malik
- Building the Kernel of Tomorrow with eBPF by Joe Stringer
Learning resources:
- Capture the Flag Challenge for eBPF Summit 2023
- Learning eBPF labs on ebpf.io
- Join the virtual meetup group for monthly insights.
A new documentary on how eBPF changes the world will be released at KubeCon NA in November.
🌱 The Inner Dev learning ...
🐝 The Inner Dev learning eBPF
Container Days sparked a lot of conversations after my talk, for example how to distribute eBPF programs. The Inspektor Gadget maintainers Jose Blanquicet and Qasim Sarfraz shared ideas on how to tackle the distribution problem in cloud-native environments, recommend following the Implement Containerized Gadgets epic. After all, analyzing performance problems or incidents should be more efficient. On a Linux VM, you can run htop, iostat, vmstat, tcpdump -- this gets trickier in distributed deployments, container networking, and underlying nodes and pods. Inspektor Gadget is a CNCF sandbox project, that provides handy tools for analysis. It can run bpftrace compatible scripts on a Kubernetes cluster, too.
Zero code instrumentation (or: auto-generate observability data) for applications became one of the efficiency innovation drivers in 2023; next to AI, value streams and capacity planning. Leveraging eBPF to subscribe to system events, trace syscalls, and gather insights helps everyone to better debug incidents. Developers do not want to learn a new (OpenTelemetry) SDK language, understand context propagation, and estimate performance impact or potential bugs -- left shifting Observability is needed but in the most efficient way. The audience at Container Days asked about auto-generated tracing in GitLab (I created a feature proposal), and Ari Recht joined me for a passionate discussion about developer efficiency, and where eBPF can help with distributed tracing without code changes, in Odigos. He also teased new features for Java tracing, follow Keyval for updates.
eBPF and all emerging tools are amazing innovations - but what are the use cases? Top 20 Cilium Use Cases sheds light on this question and can be helpful on your evaluation journey. At Container Days, I touched on that question in my talk. We also discussed performance impacts, alternatives, and the best approach for infrastructure evaluation. My tips are: Create a list of tools and vendors. Map out the similarities, and note the unique exclusive features for later. Define use cases (Observability for developers or SREs, security policy monitoring, networking, and routing, etc.) and evaluate specific features. You might not use all features in a platform yet -- expanding more features on the same platform can be helpful to avoid tool sprawl and reduce maintenance and learning overhead.
The Sysdig article eBPF Offensive Capabilities – Get Ready for Next-gen Malware changes sides into risks with eBPF and unauthorized data access, providing thorough code examples. Imagine loading eBPF programs with curl | bash patterns or receiving pull/merge requests injecting supply chain attacks. DevSecOps best practices are required on new levels. I have touched on a few ideas for security chaos engineering using eBPF in this project -- the Sysdig article also provides ideas on how to verify reliability and security policies using eBPF.
Quick wins:
- Karan Sajnani started a new series to learn eBPF: Setup and bpftrace, fork/exec tracing
- eBPF for security: a beginner's guide dives into Linux auditing, and how it can be achieved using eBPF sensors.
- Unit Testing eBPF Programs
- BPFAgent: eBPF for Monitoring at DoorDash
- Tracing SSH User Activities Using eBPF
🤖 The Inner Dev learning AI/ML
Learning a new programming language with a little help from AI has been a fun exercise past month. My team mate Fatima invited to the C++ Dragon Realm, and we explored unexpected code suggestions along side creating and playing an adventure game.
"AI/ML Implementations Aren’t Expected to go Smoothly" emphasizes the security responsibility of everyone in the DevSecOps lifecycle, following the Security Boulevard article and the GitLab Global DevSecOps AI report. The article about How to securely build product features using AI APIs discusses more technical approaches and potential solutions.
Civo announced product improvements for their machine learning platform at Civo Navigate. Kubeflow as a service to accelerate machine learning experiments on Kubernetes to lower the entry barrier, together with GPU-enabled clusters.
Tracking machine learning experiments got simpler with GitLab's seamless integration with MLflow. GitLab acts as the MLflow backend - create experiments and "candidates" (MLflow runs) easily using the MLflow client, and connect the client to your GitLab project, and voilà! Experiments and runs are neatly tracked within GitLab. Learn more on LinkedIn and this blog post.
LiteLLM provides an abstraction layer to LLM APIs (OpenAI, Azure, Huggingface, etc.) to translate inputs for provider completion and guarantee consistent output formats. LiteLLM also supports observability callbacks and logging. This looks promising for projects supporting different providers.
OpenLLMetry is a set of extensions built on top of OpenTelemetry that gives you complete observability over your LLM application. Because it uses OpenTelemetry under the hood, it can be connected to your existing observability solutions - Datadog, Honeycomb, and others. Bookmark this!
👁️ Observability
Support for Profiling as a data model in OpenTelemetry has been suggested in this PR, This moves the observability data to just being data types with different sources and not pillars. Looking forward to seeing vendors adopt this new data type and correlate more observability events for efficient debugging.
Auto-instrumentation in .NET is possible by attaching to application methods during runtime without changing the code, similar to Java. The blog post Auto-instrumentation of .NET applications with OpenTelemetry describes how the Common Language Runtime (CLR) profiler works together with OpenTelemetry, leveraging the .NET profiling APIs under the hood. The OpenTelemetry endpoints are shown with Elastic, but would work with any running OTel collector receiver. The OpenTelemetry .NET instrumentation provides support for traces, metrics and logs. I suggest reviewing their production readiness in the docs).
Nginx created a native OpenTelemetry module to help inspect HTTP requests, with filters for parent-based and ratio-based tracing.
Quick-wins:
- Talk recording: Effective and Efficient Observability with OpenTelemetry
- Talk recording: Sprinkling eBPF onto Your Observability
- Tutorial: Relabeling in Prometheus | Relabeling Architecture and Flow, Configuration, Examples, Debugging
- Tutorial: Dealing with Missing Time Series in Prometheus
🛡️ DevSecOps
I learned a new term this month: Interactive Application Security Testing (IAST). The blog post from New Relic helped understand the differences to Static and Dynamic Application Security Testing, where IAST essentially combines the best of two worlds: Access to source code, and runtime security testing. It also simulates security attacks that may degrade the system performance, and as such, should only be used in pre-production environments. The New Relic IAST demo uses the OWASP Juice shop for simulating and detecting attacks. The New Relic agent for NodeJS provides the IAST integration as part of the security agent integration. The IAST capabilities are in public preview.
7 Ways to Escape a Container is a great reminder how vulnerable default cloud-native environments still are.
Falco is a Kubernetes threat detection tool, and CNCF project. You can manage Falco plugins and rules using the falcoctl CLI, and use OCI artifacts to store them in external registries, for example in the GitLab Container Registry which now supports Falcoctl OCI Artifacts. Thanks for your contributions, Batuhan Apaydın and Emin Aktas!
🌤️ Cloud Native
Aurélie Vache continues her great series "Understanding Kubernetes" with part 49 – Kubernetes 1.28 Changelog, visually explaining native sidecar container support, validating admission policies, and stable support for non-graceful node shutdown and kubectl events, and much more.
Red Hat wrote about Introducing Kepler: Efficient power monitoring for Kubernetes as a CNCF sandbox project in the CNCF TAG Environmental Sustainability. Kepler can also be used without Kubernetes to monitor the power consumption of individual processes on Linux.
The HashiCorp BSL license change created more uncertainty with updated terms of service for registry.terraform.io, prohibiting use with forks (Reddit discussion), such as the announced OpenTF fork. This article provides an interesting view from a business analyst, while this article discusses the problems with forks and compatibility.
📚 Tools and tips for your daily use
- kubectl np-viewer is a
kubectlplugin to visualize network policies rules. - docker compose: include allows for improved modularity in Docker setups.
- eBPF explorer is Web UI that lets you see all the maps and programs in eBPF subsystem.
- JetBrains RustRover is a new IDE for Rust developers.
- xurlfind3r is a command-line interface (CLI) utility to find domain's known URLs from curated passive online sources.
- little-rat is a small chrome extension to monitor (and optionally block) other extensions' network calls
- "If you go to chrome://settings/adPrivacy you can turn off the spyware that got inserted into the latest version of Chrome." -- Thanks Paul Graham.
🔖 Book'mark
- Security Chaos Engineering: Sustaining Resilience in Software and Systems, a book by Kelly Shortridge with case studies by Aaron Rinehart.
- solo.io Academy: Network Foundations, building blocks for cloud-native
- Cilium Hubble Cheatsheet – Kubernetes Network Observability in a Nutshell
- ClickHouse Academy - How to sessions, YouTube playlist
🎯 Release speed-run
Flux v2.1.0 comes with performance improvements and enhanced Git and alerting capabilities.
Istio 1.19 brings Service Mesh support with the Kubernetes Gateway API release v0.8.0 release, and ambient mesh, a replacement deployment model instead of the sidecar model.
Grafana Pyroscope 1.0 unifies the capabilities from Pyroscope SDKs and Grafana agent for auto-instrumentation. Future releases will tackle linking profiles to traces in OpenTelemetry.
Odigos v0.1.67 brings a new UI and CLI to work more efficiently with the observability data.
I wrote about Akita for automated API Observability in May 2023 - Postman has now acquired Akita.
🎥 Events and CFPs
- Sep 20-21: Swiss Cloud Native Day, Bern, Switzerland.
- Sep 26-27: Kubernetes Community Days Austria in Vienna, Austria.
- Sep 28-29: PromCon EU 2023 in Berlin, Germany.
- Oct 2-6: DEVOXX Belgium, Antwerp, Belgium.
- Oct 6-7: DevOps Camp Nuremberg, Nuremberg, Germany. See you there!
- Oct 10-12: SRECON EMEA in Dublin, Ireland.
- Oct 17-18: Kubernetes Community Days UK in London, UK.
- Nov 6-9: KubeCon NA 2023, Chicago, IL. See you there!
- Nov 6: Observability Day at KubeCon NA 2023, Chicago, IL. See you there!
- Nov 6: CiliumCon at KubeCon NA 2023, Chicago, IL. See you there!
- Nov 6: AppDeveloperCon at KubeCon NA 2023, Chicago, IL.
- Nov 16-17: Continuous Lifecycle / Container Conf in Mannheim, Germany.
2024
- Jan 1 - Mar 31: 90DaysOfDevOps 2024 Community Event, virtual, online.
👋 CFPs due soon
- Jan 1 - Mar 31: 90DaysOfDevOps 2024 Community Event, virtual, online. CFP is due on Nov 2.
Looking for more CfPs?
- CFP Land.
- Developers Conferences Agenda by Aurélie Vache.
- Kube Events.
- GitLab Speaking Resources handbook.
🎤 Shoutouts
Kitboga for the laugh about "Scammers vs Impossible Password Game".
🌐
Thanks for reading! If you are viewing the website archive, make sure to subscribe to stay in the loop! See you next month 🤗
Cheers,
Michael
PS: If you want to share items for the next newsletter, just reply to this newsletter, send a merge request, or let me know through LinkedIn, Twitter/X, Mastodon, Blue Sky. Thanks!